 If you are looking for a great tool to conduct a root cause analysis (RCA), or find a problem during a retrospective, try out the Fault Tree Analysis (FTA). It is used to identify causes of failures, weaknesses of a system, or the probability of a certain failure happening. I prefer this method over 5-whys and Ishikawa (fishbone) diagram because it has no limitations regarding the depth and width of the analysis, can find multiple root causes, is repeatable, and anybody can interpret the result.
The FTA is a deductive (top-down) technique. It starts with defining the problem (the top event), and finding those events that contribute to it. After all the child events have been found, the analysis continues with examining them individually similarly to top event in the previous iteration. This recursive technique ends when the events cannot be broken down (basic or undeveloped events) or it reaches the boundary of the system under analysis.
Building the tree isn’t the first step in the process, it is the third actually. The Fault Tree Analysis starts with defining the top event. The top event describes the problem or a possible failure we would like to avoid (that’s why we are doing the analysis in the first place). For example, “the build is broken”, “it takes 5 seconds to render the page”, “our retention rate is 5%”, or “site_checker’s first release attempt failed”.
The next step (the second) is to put the top event into context. For a successful analysis it is crucial to understand the system and set the scope because otherwise the analysis will enter areas that are unknown to the participants, or they have no influence on it. For example, I’m examining the top event “site_checker’s first release attempt failed”, and in this case, the scope is reduced to myself, my computer and how I’m using my tools. Obviously, gemnasium, nokogiri, or travis are not part of my analysis simply because I have no influence over them.
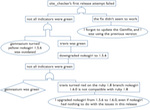
Now I can build up the Fault Tree Diagram (FTD). It is a logic diagram that contains events that are connected through gates. Have a look at the simplified version of a diagram I created after a recent event:
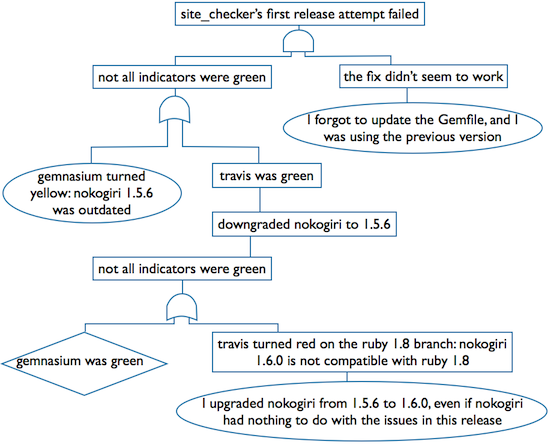
Without actually knowing what the different shapes mean you can make an educated guess what lead to the top event: one or more of the [basic] events at the bottom.
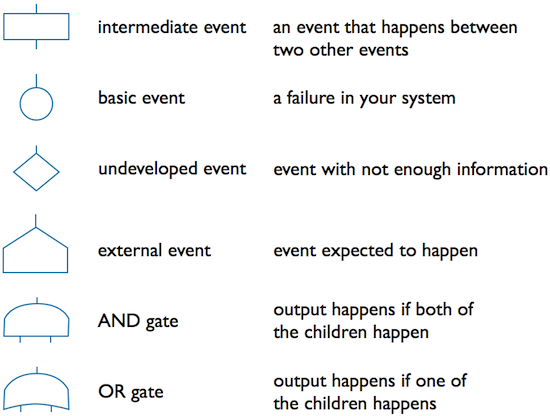
To be able to interpret the Fault Tree Diagram properly here are the descriptions of the most common events and gates:
Constructing the Fault Tree Diagram is not as easy as it looks. It is hard and very time consuming because we have to think backwards. Humans naturally thinks forward (e.g. “if I do this and that, then this and that will happen…”). To make it easier there are a couple of recommendations.
First, when you write an event check if it is clear (precisely states what the event is), immediate (closest in time and space), necessary (the parent event cannot result from a grandchild event without the child event), and efficient (if the child event happens the parent event happens in every circumstance). Second, don’t start analysing a child event until all the other child events of the parent event are discovered. Third, try not to connect gates to gates (it’s very unlikely that this is justified). Fourth, work with intermediate event. If you cannot break down an event into more details, check if it is a basic event (a failure in your system), an external event (a failure in another system), or an undeveloped event (you don’t know anything about it), and switch to the appropriate one.
Finally but not least, revise the tree when it is done. Review the events, see if the parent and child events are really connected, and check if it is possible to get to the top event from each of the bottom events (now you can think forward).
The last step in Fault Tree Analysis is the evaluation of the tree. If you created the tree for Root Cause Analysis, then the basic events are the root causes you are looking for. In my case the root cause was that I upgraded nokogiri from version 1.5.6 to 1.6.0, when I had no reason to do so, and I forgot to install the latest version under my website and was testing with an old version.
If you created the tree to figure out the possibility of a certain failure happening, the Fault Tree Diagram can help you with that, too. If you know the probability (0 < p < 1) of a [failure] event happening, you can calculate the probability of the top event as well. Under an ‘AND’ gate you have to multiply the probabilities, an under the ‘OR’ gate you have to add them up. Here is an example:
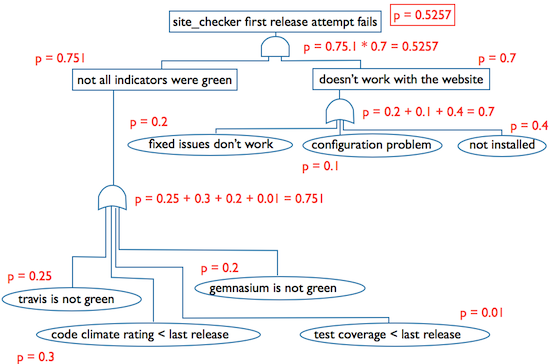
The diagram above shows the simplified version of my work and release process. P shows the probability that the failure event will happen. For example, it is very unlikely that the test coverage will decrease (p = 0.01), however having a failing build in travis is more likely (p = 0.25) because I’m supporting two ruby versions (1.8 and 1.9) and the third parties I’m using aren’t 100% compatible with both of them (finally the ruby community started to ditch ruby 1.8).
As you can see, the probability of failure at the first release attempt is rather high, 52.57%. If I was able to come up with a better solution to check the latest version with my site before release (the event “not installed” on the diagram), the p = 0.4 could go down to p = 0.1, and that would mean the probability of failure drops to 30.04% (p = 0.3004).
I admit that the Fault Tree Analysis is hard and time consuming. The Fault Tree Diagram can be very large and complicated (that’s the reason why I’m sharing only the simplified versions), and different people might set up a different tree under the same top event. But I still think that it provides better results than the other techniques such as the 5-whys and fishbone, but I don’t want to repeat everything I wrote in the beginning. If you have a problem and really would like to do a deep dive into it, give the Fault Tree Analysis a try, you won’t regret it.
comments powered by Disqus